Categories
Acoustic Testing Acoustic Treatment

UU Medford’s Acoustics Problem

“People had significant trouble hearing speakers in our church sanctuary, while carrying on a conversation in our social hall was nearly impossible. Hendrik Gideonse was able to improve both significantly. Now instead of complaints, all I hear is, “It’s so much better!” Poor sound can exclude people, and we are grateful now to be much more inclusive.” — Rev. Susan Milnor, Interim Minister, Unitarian Universalist Church of Medford, MA

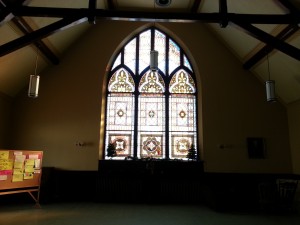
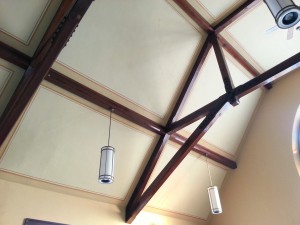
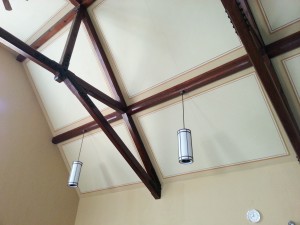
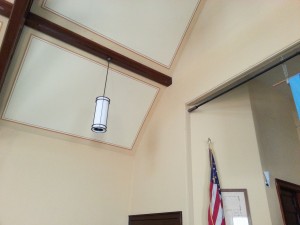
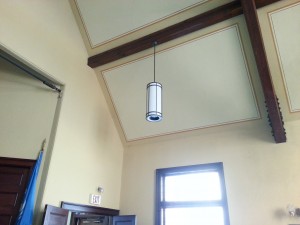
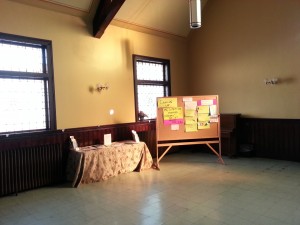
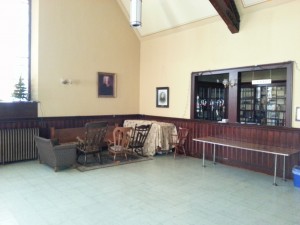
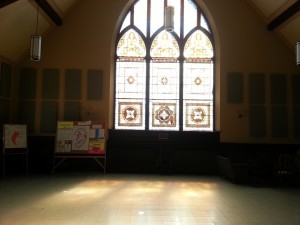
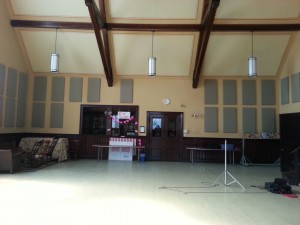
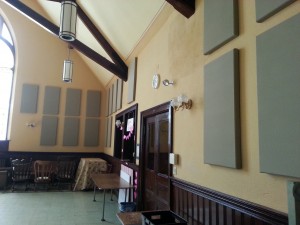
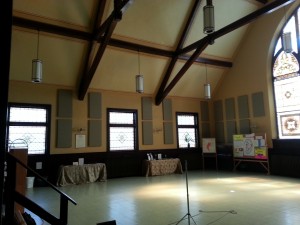
The Unitarian Universalist Church in Medford, MA has an a beautiful newly renovated room called Benker Hall. The space is used both by the church for social activities and by renters who use the space for rehearsals, meetings and performances. There is a nice sized stage, a wonderful stained glass window, and beautiful visible beams and trusses holding up the cathedral ceiling.

Unfortunately there is a serious problem with the acoustics. The room is so reverberant that is is extremely difficult to understand speech.  The long echoes in the room blur the clarity of consonants and make listening to music difficult and frustrating. As you might imagine, the ability  to understand a speaker or properly enjoy music is a critical requirement for the room if it is to fulfill its intended purpose. The room is 40 feet across and 32 feet tall. The following photos are from Benker Hall:

UU Medford 1 UU Medford 2 UU Medford 3 UU Medford 4 UU Medford 5 UU Medford 6 UU Medford 7 UU Medford 8 UU Medford 9


In order the quantify the problems with intelligibility, we performed acoustic testing to evaluate the length of the reverberation and to describe the problems created by the room’s echoes. The following data was generated using impulse response testing:
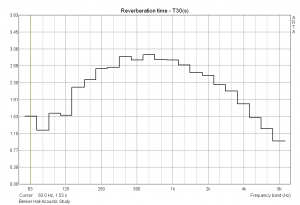
Reverb Time vs. Frequency in Benker Hall


SPEECH TRANSMISSION INDEX - MTF Matrix
---------------------------------------------------------------------
Band 125 250 500 1000 2000 4000 8000
---------------------------------------------------------------------
0.63 0.9300 0.8481 0.7895 0.7970 0.8467 0.8968 0.9618
0.80 0.8962 0.7855 0.7054 0.7143 0.7786 0.8458 0.9398
1.00 0.8615 0.7273 0.6280 0.6373 0.7123 0.7931 0.9146
1.25 0.7962 0.6320 0.5003 0.5088 0.5939 0.6922 0.8583
1.60 0.7429 0.5665 0.4055 0.4148 0.4973 0.6039 0.7991
2.00 0.7074 0.5247 0.3383 0.3436 0.4198 0.5294 0.7407
2.50 0.6909 0.4827 0.2804 0.2629 0.3296 0.4398 0.6583
3.15 0.6941 0.4374 0.2458 0.2278 0.2442 0.3492 0.5600
4.00 0.6646 0.4049 0.2044 0.2019 0.1996 0.2687 0.4540
5.00 0.6204 0.4042 0.1719 0.1498 0.1670 0.1977 0.3473
6.30 0.6054 0.3831 0.1406 0.1319 0.0955 0.0834 0.2310
8.00 0.5187 0.3389 0.1101 0.1210 0.0606 0.0265 0.1343
10.00 0.5007 0.2945 0.0517 0.0856 0.1097 0.1063 0.1433
12.50 0.4775 0.1447 0.1221 0.1456 0.1166 0.1527 0.1898
---------------------------------------------------------------------
OctTI 0.6354 0.5002 0.3748 0.3813 0.3963 0.4338 0.5657
---------------------------------------------------------------------

STI = 0.4330 (male), 0.4327 (female) Rating: POOR (POOR)
(%ALcons= 13.5135)

The church purchased 45 2″ thick 24″x48″ acoustic absorbers. I installed the panels with a bunch of church volunteers. As the panels went up on the walls, the acoustic response of the room steadily improved. When completed the room was significantly quieter, meaning the room was not amplifying speech as much. The reverb time was reduced audibly, but the real change was in the nature of the reverberation. The ambiance of the room was cleaner, less distracting and simpler. Older congregants and those with hearing loss were extremely enthusiastic about the improvements.

The following after “after” photos:

UU Medford After 1UU Medford After 2UU Medford After 3UU Medford After 4

The testing procedure was repeated with the following results:
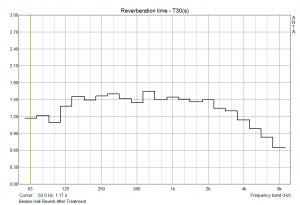
Benker Hall Reverb After Treatment

SPEECH TRANSMISSION INDEX - MTF Matrix
---------------------------------------------------------------------
Band 125 250 500 1000 2000 4000 8000
---------------------------------------------------------------------
0.63 0.9530 0.9113 0.9332 0.9303 0.9480 0.9674 0.9890
0.80 0.9271 0.8644 0.8978 0.8930 0.9196 0.9487 0.9823
1.00 0.8985 0.8141 0.8595 0.8523 0.8882 0.9275 0.9742
1.25 0.8383 0.7137 0.7826 0.7688 0.8222 0.8809 0.9550
1.60 0.7810 0.6230 0.7129 0.6899 0.7583 0.8332 0.9329
2.00 0.7316 0.5442 0.6546 0.6203 0.7008 0.7880 0.9094
2.50 0.6776 0.4501 0.5872 0.5380 0.6309 0.7283 0.8740
3.15 0.6424 0.3880 0.5202 0.4689 0.5698 0.6655 0.8301
4.00 0.6288 0.3679 0.4591 0.4097 0.5308 0.6095 0.7849
5.00 0.6059 0.3441 0.4264 0.3430 0.5076 0.5672 0.7458
6.30 0.5641 0.2547 0.4060 0.2983 0.4974 0.5452 0.7124
8.00 0.5374 0.1775 0.3337 0.2536 0.4872 0.5400 0.6835
10.00 0.4471 0.2118 0.3104 0.2135 0.4884 0.5295 0.6576
12.50 0.3994 0.1089 0.2940 0.2050 0.4446 0.5168 0.6511
---------------------------------------------------------------------
OctTI 0.6419 0.4937 0.5690 0.5349 0.6197 0.6726 0.7813
---------------------------------------------------------------------

STI = 0.6195 (male), 0.6274 (female) Rating: GOOD (GOOD)
(%ALcons= 5.8988)


Categories
Acoustic Ramp Diffuser Acoustic Testing Acoustic Treatment Installs & Custom Studio Design

First Acoustic Test @ the New XMIX Studio

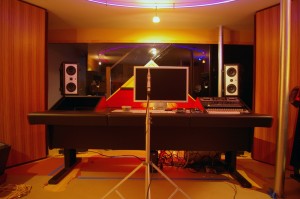
Last weekend I was doing the first listening and acoustic testing in Larry Clawson’s new XMIX studio. Last year Larry hired me to design his control room and the studio is now nearly completed! Here are some of the pictures of that first test session. The room sound extremely good considering that side walls and ceiling are untreated. Barefoot monitors help. The wood is Ribbon Stripe Sapele. Black granite counter tops.

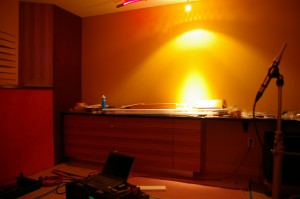
This is the view from a couple feet behind the sweet spot. Earthworks mic is being used for acoustic testing.


XMIX Studio Rear Wall
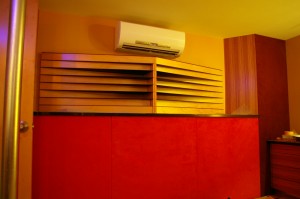
The view towards the rear wall of the studio complete with Mr. Slim ductless, some nice black Ramps and custom made broadband absorbers. The counter is black granite.


XMIX Studio Side Wall
The side wall of the studio with built in cabinetry and another black granite counter top. Reflector and bass trapping in the corner.


Categories
Acoustic Ramp Diffuser Acoustic Testing Acoustic Treatment

Trying New Web Design

You may have noticed that our website looks completely different. It actually is completely different. We are trying different types of web designs to see what works the best for our customers and for the robots and spiders that hangout on the site. If you have any questions or comments, please get in touch!


Categories
Acoustic Testing Customer Testimonials

Jay Hovnanian, Studio HOV

“I met Hendrik at a pro audio expo [Parson’s Expo], and as audio people often do, we got to talking – specifically, about my control room acoustics (which, admittedly, I can be a little skeptical about).  Even so, I felt very comfortable in our conversation and asked Hendrik to evaluate the space I mix in.  If I would ever perceive and overcome acoustical limitations, it would begin with an objective and thorough evaluation of the room.  This Hendrik did, producing more data and charts than I would have expected.  As a result, I have made some modest adjustments that have clearly enhanced the width and depth of the three dimensional space between my monitors. ”
             –Studio HOV | Methuen, MA | 978-807-5739


Categories
Acoustic Ramp Diffuser Acoustic Testing Acoustic Treatment Products Ramp Specs

Acoustic Ramp™ vs. RPG’s QRD 734

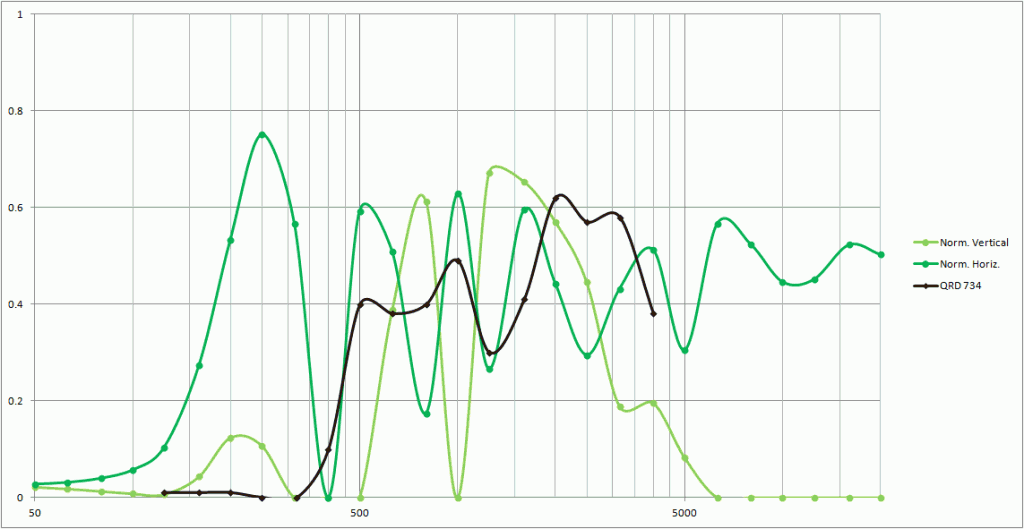
We now have a way of comparing apples to apples!  Using the methods described in AES-4id-2001 (r2007) “Characterisation and measurement of surface scattering uniformity,” we now have a direct comparison of the Acoustic Ramp and RPG’s QRD 734.

The Acoustic Ramp vs/ RPG's QRD 734
The Acoustic Ramp vs. RPG's QRD 734

The black line is the QRD 734 and the green lines are the Acoustic Ramp™.  Please note that BOTH of the green lines are happening at the same time, so you’re comparing both the green lines to the black line. As you can see the Ramp™ extends the frequency range way above and below the 734.

So we’re actually comparing a super-yummy Ginger Crisp apple to a mealy Red Delicious. Which is which?

Categories
Acoustic Ramp Diffuser Acoustic Testing Products

How Was The Acoustic Ramp Tested?

Vertical Test Sketch
A sketch of testing a Ramp in the vertical position

Acoustic testing on a budget is a daunting task.  Many measurements need to be made, and sometimes several batteries of tests are required to get valid data. In the case of testing the Acoustic Ramp, I actually did an entire battery of tests that proved later to be invalid.  The good news, is that I learned from my mistakes and the second battery provided good repeatable and valid data.

My test process is essentially this: Shoot a swept sine wave from a high quality studio monitor at the diffuser and record what bounces back from the diffuser with a high-quality microphone placed on the circumference of a circle with the diffuser at its center. Then I move the microphone 5 degrees along the circumference and repeat the test.   Software assembles all of the data into impulse responses that when combined can create a sonogram which shows amplitude, frequency and the position of the microphone in relation to the diffuser.

Here are some photos showing the process of the testing:

Laying out the test locations
Laying out the test locations. Each piece of white tape is marked with the exact location of the microphone for each test position.


The test computer, audio interface and microphone preamplifier
The test computer, audio interface and microphone preamplifier. I am using a PC laptop with Windows XP, ARTA Acoustic Testing Software, a MOTU Traveler, and a Daking Mic Pre One microphone preamp for the testing.


The first test is with a flat panel
The first test is with a flat panel to be used as a control to compare between the effect of the diffuser and that of a flat reflective surface


Testing in the vertical position
Testing in the vertical position with a single acoustic ramp


A second view of the vertical position


Testing in the horizontal position
Testing in the horizontal position using a Mackine HR824 loudspeaker


Another view of testing in the horizontal position


Categories
Acoustic Ramp Diffuser Acoustic Testing Acoustic Treatment Products

Acoustic Ramp™ Test Results

Sonogram Directivity Results

Flat Panel Test 200Hz-18000Hz
Flat Panel Test 200Hz-18000Hz (Control Group)
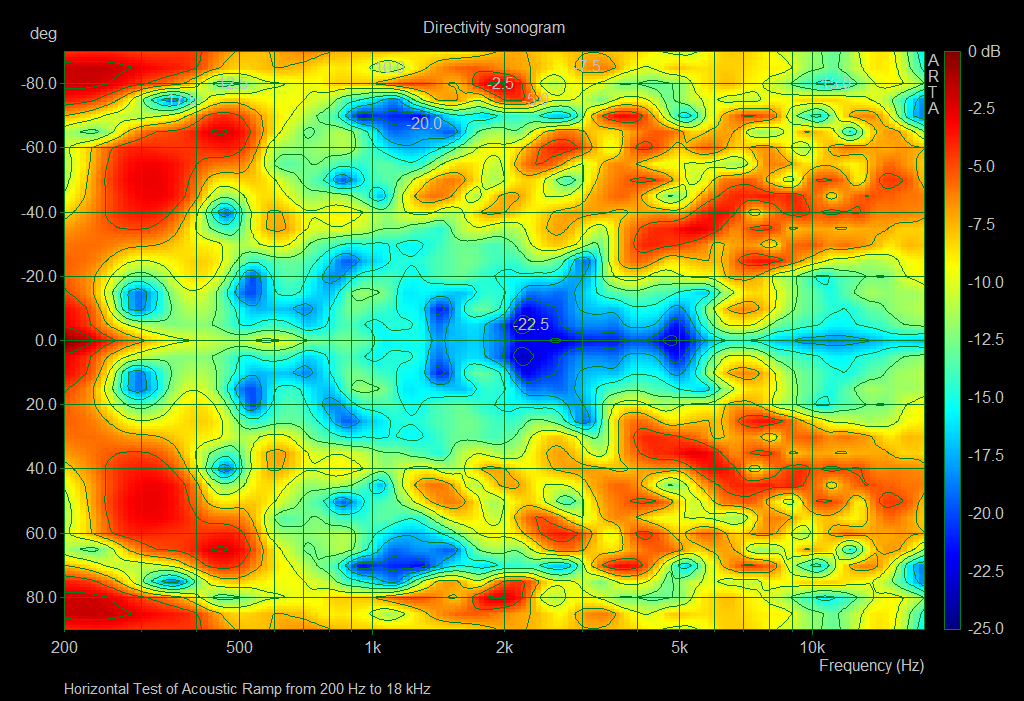
Horizontal Ramp Test 200Hz-18000Hz
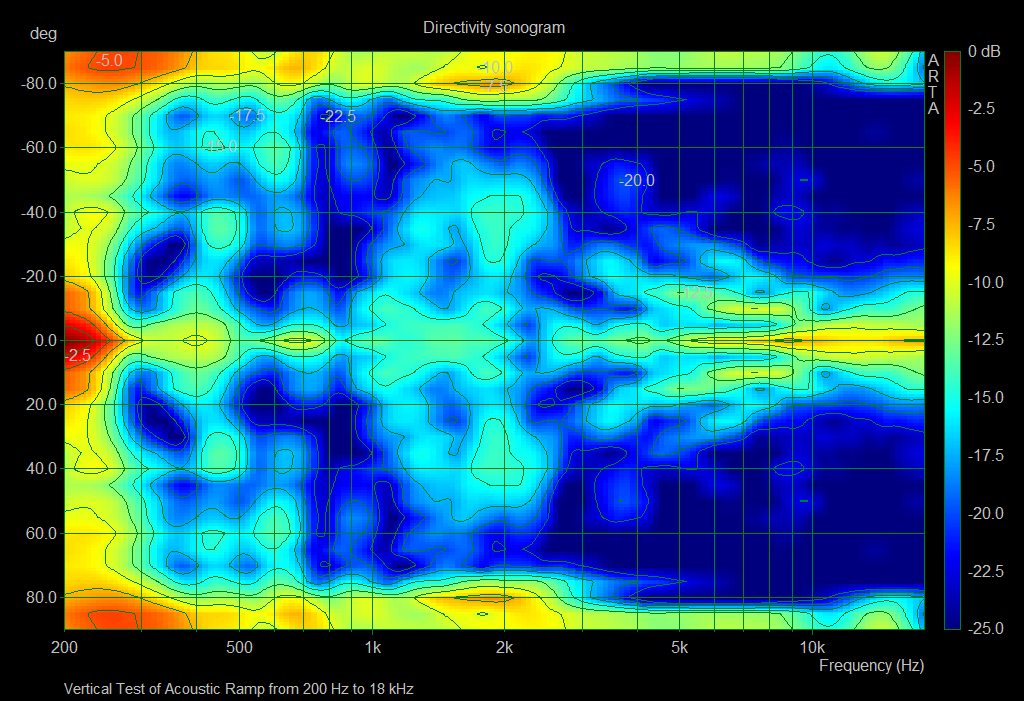
Vertical Ramp Test 200Hz-18000Hz

How Does It Work?

Acoustic Diffusion is not an easy thing to test or describe.  In fact in the academic acoustics world there is a big controversy about the best way to describe and measure diffusion: the Scattering Coefficient or the Diffusion Coefficient.

“You will know it works when you hear it,” is true but probably not a good explanation. I am going to avoid this whole dispute by publishing the actual data of all frequencies and amplitudes in my tests.

I did several rounds of acoustic testing on the Ramps and here is what I found:

  1. The Acoustic Ramp scatters frequencies horizontally from about 300 Hz to about 4000 Hz (4kHz), but doesn’t do a lot below or above this bandwidth
  2. The Acoustic Ramp scatters and reflect frequencies vertically from about 300 Hz all the way up to 20000 Hz (20kHz)

The Ramp does both of these things at the same time. So if you install the diffusers on their sides, it only changes which orientation scatters and which one reflects and scatters.

Why Do We Want To Scatter the Sound Anyway?

When sound strikes a hard flat surface most of the sound bounces off the wall as an echo. That echo can interfere with the sound that is headed towards the wall by cancelling out certain frequencies and emphasizing other frequencies. This effect is called comb-filtering. You just cannot hear sound accurately in a room that has comb-filtering problems. Scattering the sound breaks up echoes into many little tiny echoes diminishing their effect.  The Ramp also reflects sound away from the sound source, further minimizing the effect of comb-filtering.

Reflections can also be controlled with absorption of course, but absorption-only treatments tend to yield rooms that sound dead and lifeless.

How Do you Read Those Diagrams?

Those diagrams are called “sonograms” and they were generated from data gathered using the software package ARTA. There will be a later post about the testing procedure, but for right now let’s focus on the diagrams.

Flat Panel Test 200Hz-18000Hz

The Sonogram shows Amplitude (color), Frequency (x-axis), and Directivity (y-axis).  The above diagram shows what happens when you place a loudspeaker directly in front of a flat panel.  The bright yellows and reds show loud levels and the blues and dark blues show quiet levels. The stripe of brightness that goes horizontally across the center of the diagram shows that sound is bouncing right back towards the speaker. At about 500 Hz the sound is bouncing at about 30 degrees and 50 degrees off-center.  And from about 300 Hz and below the reflection pattern is pretty wide.

If there is pretty good diffusion at a specific frequency the diagram will show a vertical band of similar colors. Horizontal bands of similar color means that there is an intense specular reflection at a specific angle.  For instance, in the above flat reflector model, there is a very strong reflection at 0 degrees, meaning that sound hitting the reflector is bouncing straight back to the loudspeaker. If the reflector had been angled at 45°, we would expect there to be an intense band at around 45° as well.

In the horizontal test of the Acoustic Ramp™ you can see that nearly all of the energy is directed away from bounding back towards the sound source because the center of the diagram shows darker blue colors.

Horizontal Ramp Test 200Hz-18000Hz

In the vertical test of the Ramp you can see the scattering of frequencies from about 300 Hz to around 4 kHz.

Vertical Ramp Test 200Hz-18000Hz